Inno AI Report — User Guide
Version 1.0.1 · inno software · support@innosw.net
Inno AI Report adds an AI Analysis tab to a Splunk dashboard you already have. When someone presses Analyze, the app collects the panel results that are on screen, summarises them, sends them to your Splunk AI Toolkit connection with the | ai command, and shows a report with a status grade, likely causes, recommended actions and the team to contact.
You do not edit the dashboard source, and the app does not need to know what your searches do.
Contents
- Before you start
- Install
- First-time setup: the AI engine connection
- Add the AI tab to a dashboard
- Run the analysis
- Read the report
- Business domains and report languages
- Change the prompt
- Revert or re-apply
- Troubleshooting
- Performance and data handling
1. Before you start
| You need | Notes |
|---|---|
| Splunk Enterprise | Tested on 10.2.2 and 10.4.0. Dashboard Studio and Classic dashboards are both supported. |
| Splunk AI Toolkit with at least one LLM connection | The | ai command must run for the user who presses the button. An administrator creates the connection in AI Toolkit. |
| Inno AI Report | Free on Splunkbase. |
| Permissions | Edit the target dashboards, write to the app's backup KV store collection, and use the AI Toolkit connection. |
2. Install
Standalone search head
- Install the app from Splunkbase, or extract it into
$SPLUNK_HOME/etc/apps. - Restart Splunk. The app ships custom visualizations and
.conffiles, so a restart is required. - Open Inno AI Report from the Apps menu.
Search head cluster — install through the deployer, not on a member.
- Extract the app into
$SPLUNK_HOME/etc/shcluster/appson the deployer. - Run
splunk apply shcluster-bundle -target https://<member>:8089. - Open Inno AI Report on any member.
An app installed directly on a cluster member is removed when that member restarts.
No server configuration changes are needed (no server.conf, web.conf, CORS, proxy or authentication settings). After upgrading the app, open /<locale>/_bump once (for example /en-US/_bump) so browsers load the new visualization code.
3. First-time setup: the AI engine connection
Open Inno AI Report → AI Analysis Panel Wizard. Step 0 · AI engine connection is at the top.
- Pick the LLM connection to use and press Use this connection.
- Press Test connection and check that a response comes back.
The default AI Toolkit connection is per user. If you do not pin a connection here, the analysis can fail when someone other than you presses the button. Pin a connection for shared dashboards.
The wizard stores your choice in the inno_ai_llm search macro, for example ai prompt="{_raw}" provider="Custom" model="general".
4. Add the AI tab to a dashboard
Everything happens on one wizard page, top to bottom.
| Step | What you do |
|---|---|
| 1 · Select an app | The app that contains the dashboard. |
| 2 · Select a dashboard | Pick it, then press Scan panels. The [Studio] / [Classic] label is informational; the wizard handles both. |
| 3 · Panels to analyze | Every panel that can be summarised is included automatically. With many panels, fewer rows are sent per panel (about 10 panels → 12 rows, 11–16 → 8, 17–24 → 5, 25 or more → 4). Open Edit panel names if a panel is called something like table or singlevalue — the name is sent to the AI as it is. |
| 4 · Select the business domain | Required. A suggestion based on the dashboard name is shown in bold. See section 7. |
| 5 · Report language | Korean, English or Japanese. |
| 6 · A short description | One or two sentences on what the dashboard shows and what to cross-check. This is the most effective way to improve the report. |
| 7 · Add | Leave Add as a separate tab checked and press Add AI analysis panel. |
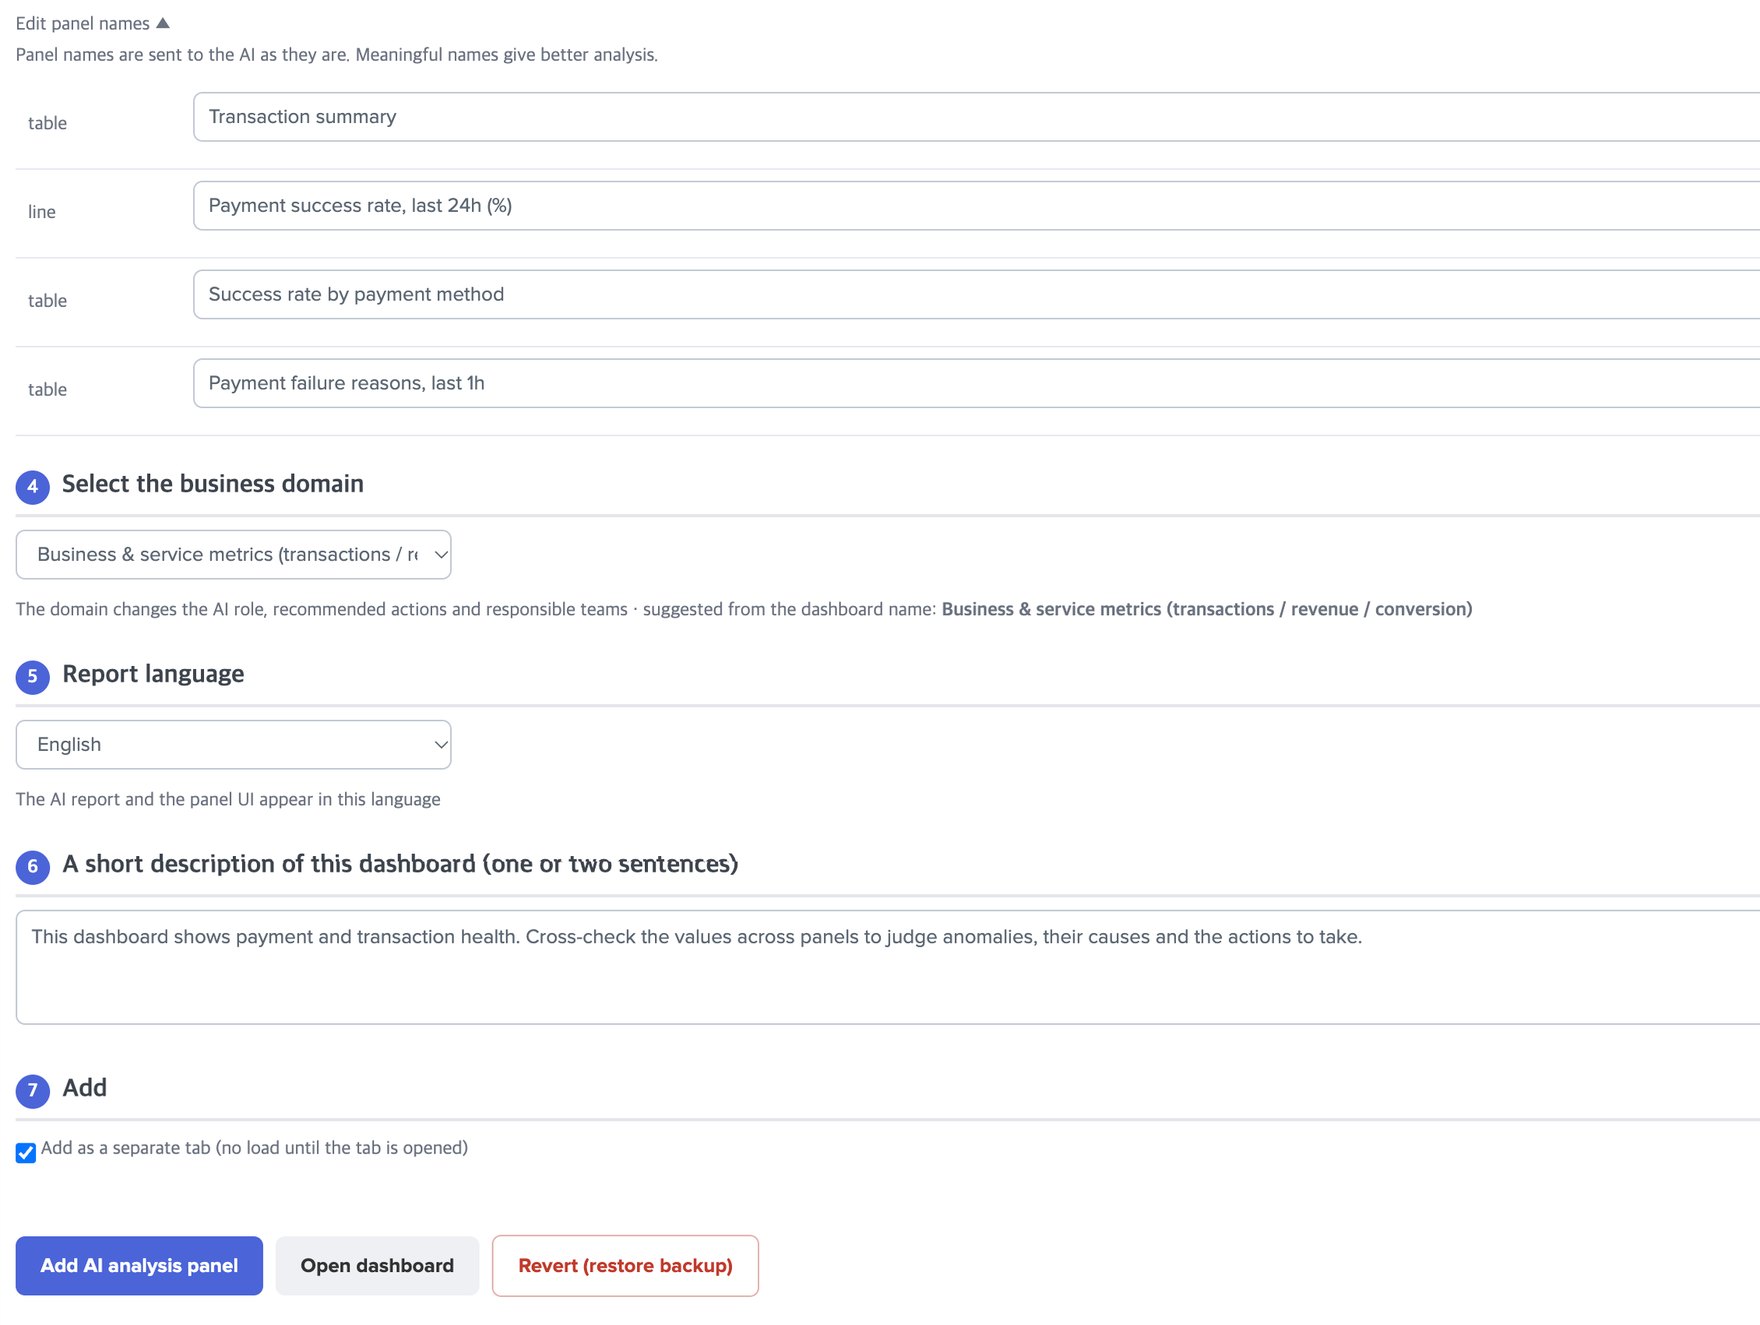
When you press Add AI analysis panel:
- The original dashboard is backed up to a KV store collection first.
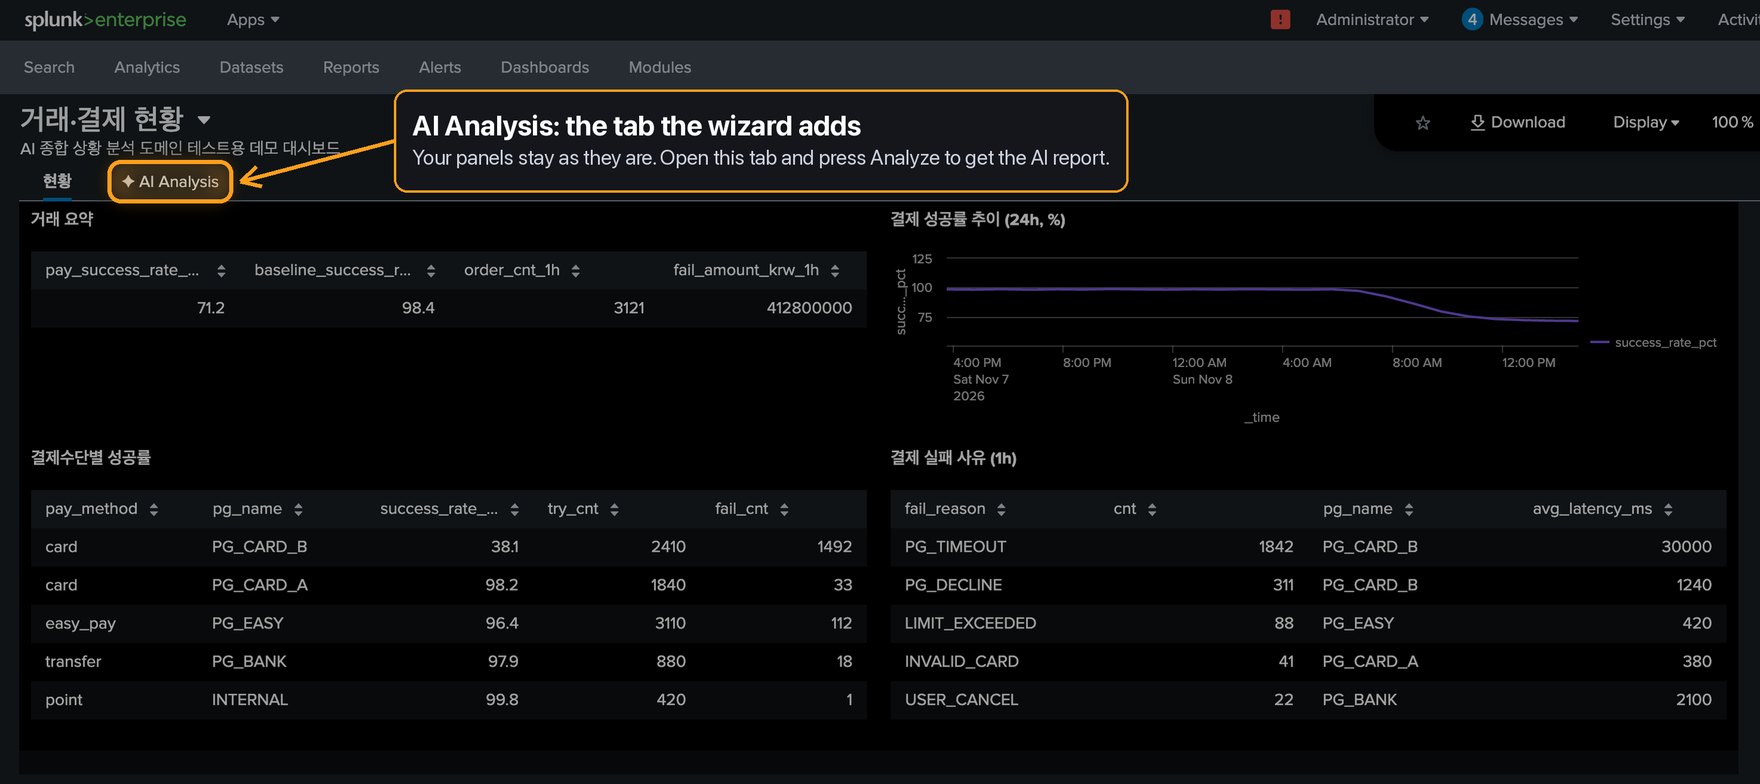
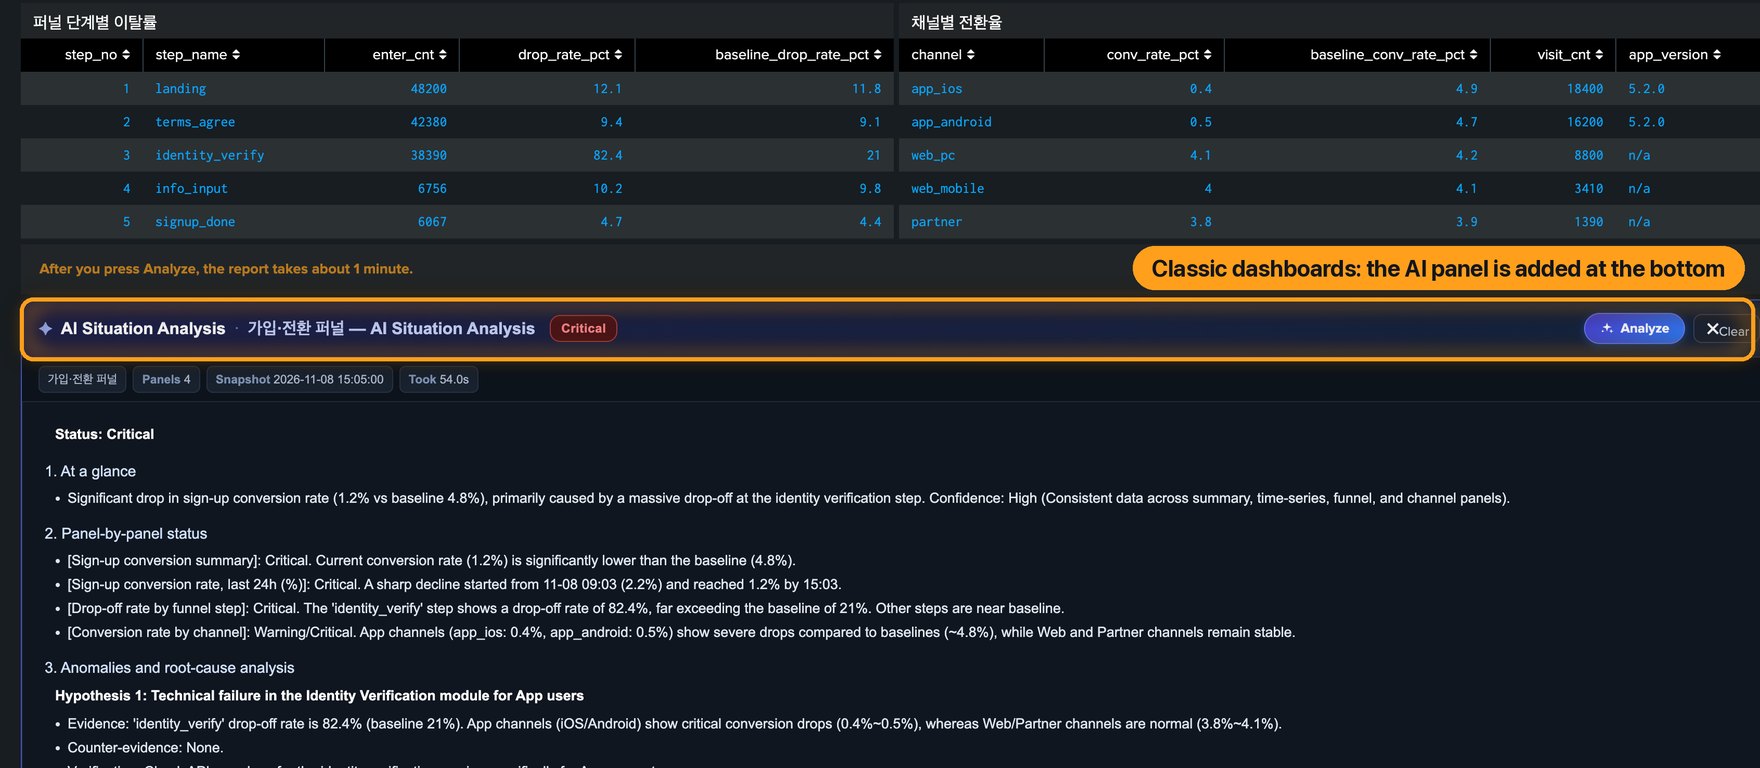
- Dashboard Studio dashboards get an ✦ AI Analysis tab at the end. Classic dashboards and older flat-layout Studio dashboards get a panel at the bottom, because Studio does not render panels that are off screen.
- Existing panels, searches and layout are not changed. Only the summarising searches and the AI card are added.
5. Run the analysis
- Set the dashboard's time range and filters first. The AI reads only the values currently on screen.
- Open the ✦ AI Analysis tab and press Analyze at the top right of the card.
- A yellow line above the card shows progress. While the model runs, Splunk covers the card with its own placeholder.
- If a red ! appears at the top right of the panel, click it and choose Run Query. The analysis uses Splunk's
mapcommand, which Splunk treats as a risky command and asks you to approve. - The report appears after about a minute (62 seconds on average in our tests).
On a busy or freshly started server the card area can stay empty for up to about a minute before the card is drawn. Wait before treating it as a failure.
6. Read the report
The first line is the status grade — Normal, Warning, Critical or Undetermined — followed by six sections:
- At a glance — one-line conclusion and confidence.
- Panel-by-panel status — one to three lines per panel, citing the values.
- Anomalies and root-cause analysis — up to three ranked hypotheses, each with evidence, counter-evidence, and what to check to confirm it.
- Recommended actions — immediate action, how to confirm the cause, how to verify recovery, with the responsible team in brackets.
- Impact scope and priority — affected services, urgency, escalation.
- Data gaps and recommendations — what was missing and which panels would help.
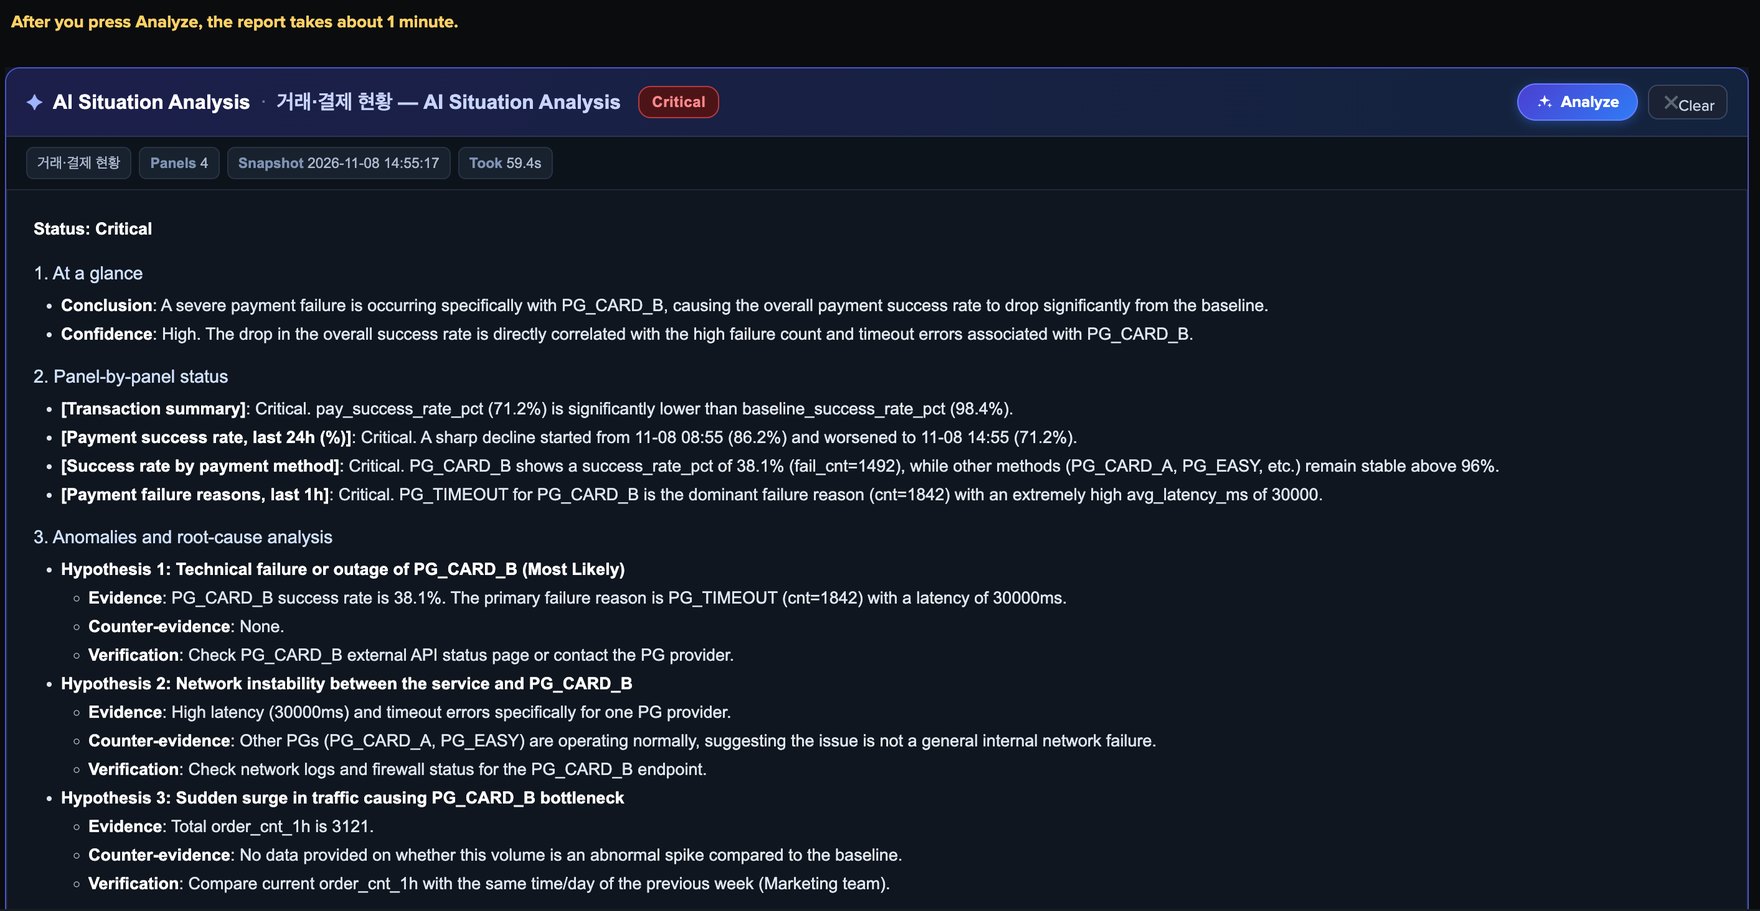
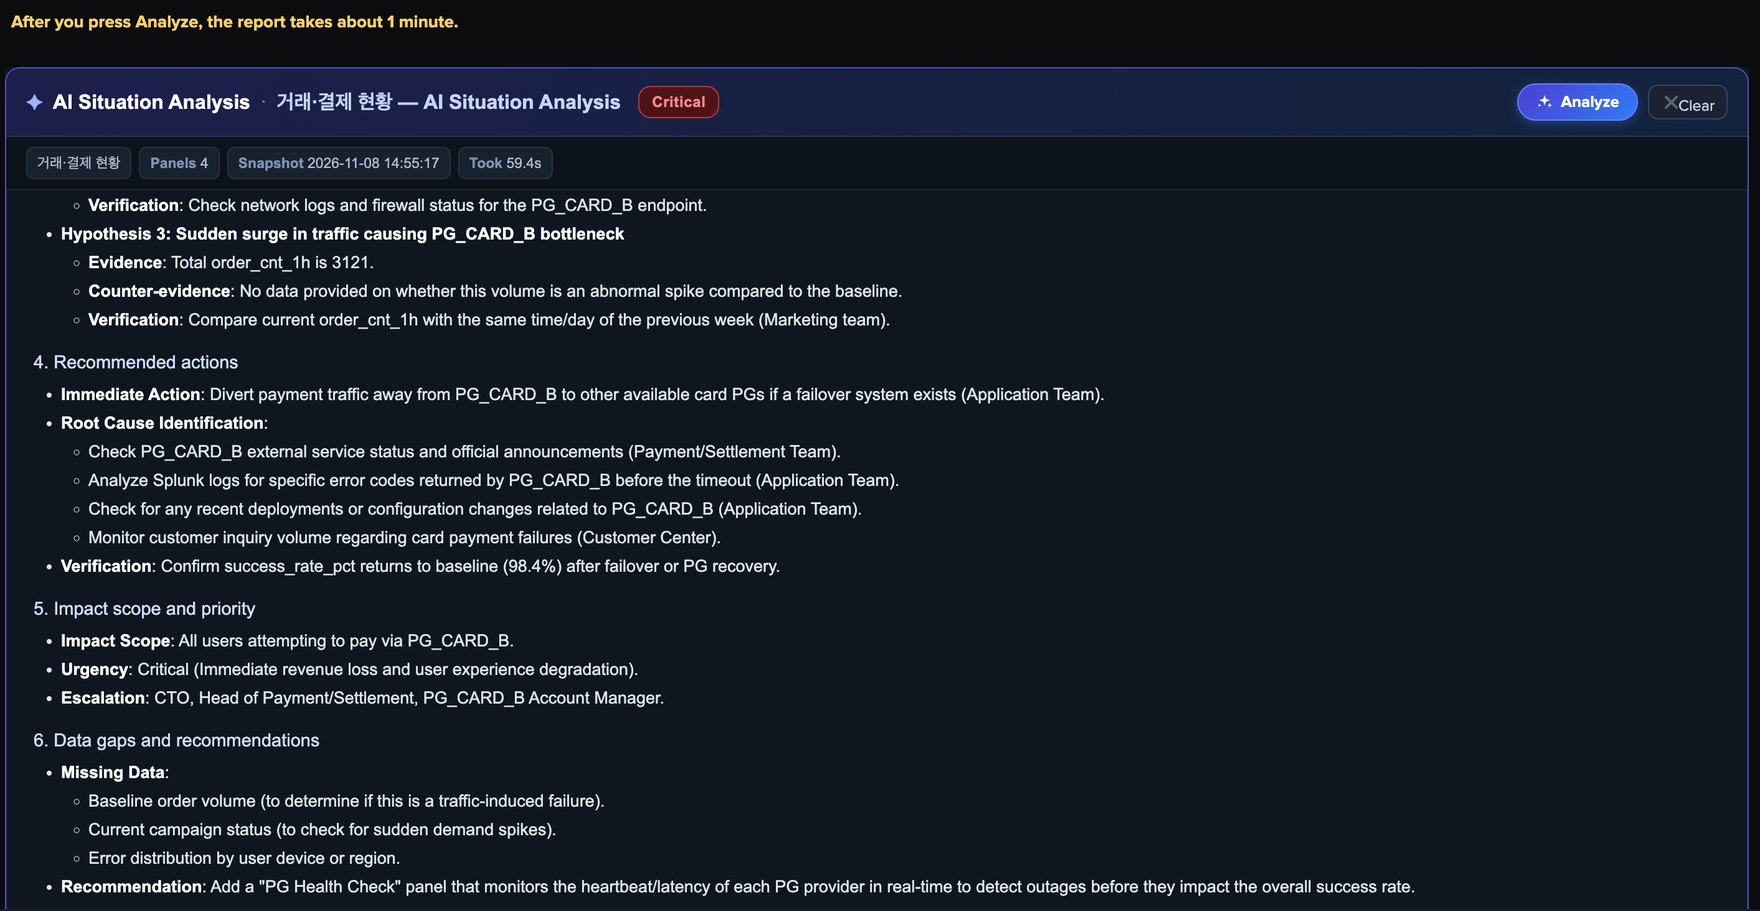
The header shows the dashboard, panel count, snapshot time and elapsed time. Expand View the prompt and data sent to the LLM at the bottom of the card to see the data snapshot that was sent.
Generated analysis can be wrong or incomplete. Use it to support a decision, and check the source data before you act.
7. Business domains and report languages
The domain changes the analyst role, what is cited as evidence, which team each action goes to, and how to verify. It changes conclusions, not just wording.
| Domain | Wizard label | AI role | Typical actions |
|---|---|---|---|
| Network | Network (ACI / Nexus / traffic / links) | NOC engineer | Interface checks, device alarms |
| Security | Security operations (auth / threats / intrusion) | SOC analyst | Account lock, EDR trace, IP reputation |
| Infrastructure | Server & infrastructure | Systems engineer | df / vmstat, log growth, capacity |
| Application | Application & DB | APM engineer + DBA | Slow-query plans, connection pools, locks |
| Business | Business & service metrics | Service operations analyst | Payment providers, deployments, campaigns |
| General | Generic (no domain assumed) | Neutral analyst | Check the source search, compare periods |
If you are unsure, choose General. In our tests, applying Network to a sign-up funnel dashboard pushed the real cause (an app release defect) to second place and sent the action to the network team; General found the cause and only kept the actions broad.
Reports can be written in Korean, English or Japanese. The language covers the report body, section titles, status labels, the card and the tab name. The instructions inside the prompt are written in Korean while asking for output in the selected language; models that read Korean well produce correct English and Japanese reports. With a model that is weak in Korean, test before rolling out.
8. Change the prompt
The prompt has five parts. The app owns the report format and the judgement rules; your choices fill in the rest.
| Part | What it contains | Change it in |
|---|---|---|
| [Role] | The analyst role for the domain | Wizard step 4 · macro inno_ai_rules_apply |
| [Data interpretation rules] | Seven rules, e.g. "judge only from facts in the snapshot", "always compare against the baseline when one is given" | Macro inno_ai_rules_base |
| [Writing rules] | Output language, status line, citing values, responsible teams, length (2,500 characters) | Wizard step 5 · macro inno_ai_rules_fin |
| [Analysis target] and output format | Dashboard name, your description, the six sections | Wizard step 6 · macro inno_ai_prompt |
| [Data snapshot] | [Panel name] followed by field=value lines | Wizard step 3 (panel names) |
Per dashboard — in the wizard
Panel names, domain, language and description are stored in that dashboard only. Scan the dashboard again and the wizard reads back the values it used; change them and press Add AI analysis panel to replace the tab. Your description is placed in the middle of the analysis-target sentence:
[Analysis target] Orders & payments — AI Situation Analysis
Judge the current situation by combining the panel results of the
'Orders & payments' dashboard. <your description> Cross-check facts
across panels and tie them into one conclusion.
A useful description says what to cross-check, for example: "Shows payment success rate and failure reasons by payment provider. Check whether failures are concentrated on one provider, card issuer or payment method." Double quotes in the description are removed when it is saved.
For every dashboard — search macros
Settings → Advanced search → Search macros, filter the app to Inno AI Report, open the macro, edit Definition, Save.
| Macro | Part of the prompt | Example change |
|---|---|---|
inno_ai_rules_apply | Role, values to cite, responsible teams, how to verify (per domain) | Use your own team names |
inno_ai_rules_base | Data interpretation rules | Add "List every value over its threshold before ranking them." |
inno_ai_rules_fin | Writing rules | Change "within 2,500 characters" to 1,500 |
inno_ai_prompt | Analysis target and the six sections | Adjust what each section should contain |
inno_ai_llm | The LLM connection to call | Set by wizard step 0 |
Each definition is an eval string: sentences go inside double quotes and line breaks are written as urldecode("%0A"). A syntax error makes the analysis search fail.
Preview the prompt without calling the model — run this in Search:
| makeresults
| eval ai_dash_title="Orders & payments",
       ai_dash_scope="Check whether failures are concentrated on one provider.",
       ai_dash_domain="biz", ai_dash_lang="en", ai_ctx=""
| `inno_ai_rules_auto`
| `inno_ai_prompt`
| eval prompt=ai_rules.urldecode("%0A%0A").ai_task
| table prompt
ai_dash_domain takes net, sec, infra, app, biz or gen; ai_dash_lang takes ko, en or ja.
Before you edit a macro
- A macro change applies to every dashboard that uses the app, from the next analysis.
- Your edit is saved in the app's
localdirectory and survives upgrades — which also means improvements to that macro in later versions do not reach you. - Keep the section titles as the variables
ai_h1…ai_h6. Typing titles in one language makes reports in the other languages show those titles too. - Edit only the
inno_ai_*macros. Thenetops_ai_*macros are compatibility aliases for an earlier build.
9. Revert or re-apply
- Revert — in the wizard select the same dashboard, press Scan panels, then Revert (restore backup). The dashboard returns to the state it was in before the AI panel was added.
- Re-apply — scan again, change the domain, language, description or panel names, and press Add AI analysis panel. The existing AI tab is replaced, not duplicated.
10. Troubleshooting
| Symptom | What to do |
|---|---|
| A red ! on the panel and nothing happens | Click it and choose Run Query. |
| The card area is empty for a while | Wait up to about a minute, especially right after a restart. |
| "The LLM call failed" | Check the AI Toolkit connection and the LLM server, then press Analyze again. Use Test connection in wizard step 0. |
| "The LLM returned an empty response" | Check the connection's Max Tokens and Request Timeout settings and the LLM gateway. |
| Status Undetermined with no data | The panels had no results. Adjust the dashboard's time range or filters and run again. |
| The report misreads the numbers | Improve the description (step 6) and the panel names (step 3), and check the domain. |
| It works for you but not for a colleague | Pin the connection in wizard step 0, and check that their role can run | ai. |
| Old behaviour after an upgrade | Open /<locale>/_bump once. |
| "Scan panels" finds nothing | HTML dashboards and dashboards with no search panels cannot be used. Panels that use a saved-search reference are listed as excluded. |
11. Performance and data handling
- The model is called only when someone presses Analyze. Until the AI tab is opened the dashboard runs no extra searches.
- The model is whichever one your AI Toolkit connection points to. The app ships no model and no endpoint, sends no telemetry, and talks to no vendor service.
- The data sent is the summarised panel results. View the prompt and data sent to the LLM at the bottom of the card shows it, and section 8 shows how to print the full prompt.
Licence: https://innosw.net/ai-report/license · Splunkbase: https://splunkbase.splunk.com/app/10252 · Support: support@innosw.net